05. Solution Breakdown
A weather experience that evolves with your holiday
The redesign addressed all three research findings in one connected system. Discoverability was solved by embedding weather insights directly into booking flows
and itinerary planning — not as a separate feature, but as a contextual layer woven throughout the app .
Instead of displaying 23°C and a cloud icon, the feature now generates a daily narrative : "Warm and mostly sunny — great for the beach in the afternoon. Brief
shower expected around midday, plan indoor time then." A contextual packing list — automatically generated from the 14-day forecast — gave customers a pre-
trip planning tool they'd never had before. Activity suitability ratings, linked to booked excursions, reduced uncertainty-driven cancellations and deepened
engagement throughout the pre-trip period.
Pre-departure

On holiday

Pre-departure - Complete view
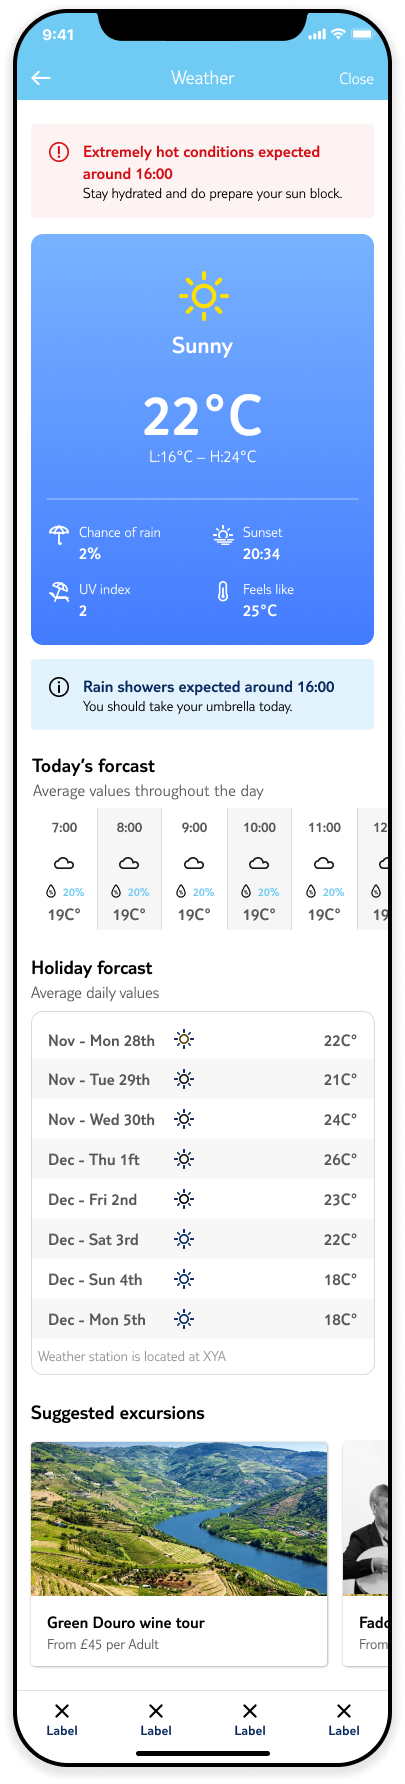
Holiday Forecast - Detail
In the planned complete version of the Holiday Forecast , set for Milestone 2, we will enhance the table by adding the chance of precipitation and the expected high and low temperatures for each day. We will also update the zebra pattern.
This will provide users with more detailed and comprehensive weather information to better plan their activities.
Pre-departure - Complete view
Widget
This widget is designed to inform users about weather conditions and can be integrated into the booking or detail pages within the app. Additionally, it functions as a standalone widget, allowing users to place it on their home or lock screens for quick access to weather updates.
Hero header - Day
Hero header - Night
Hero header - Day
The icons marked with * are considered secondary, as they will not be displayed in the header. These icons are intended for more detailed weather insights within specific sections of the app, providing additional context without cluttering the primary interface.